

 No matter whose Facebook page you're managing -- your own, your employers, or your clients -- reporting is key.
Reporting can be a great way to:
- benchmark the progress of your Facebook marketing strategy
- measure how your strategy stacks up to competitors
- show whether a return on investment (ROI) is being made
Of course, you probably don't have time to test out all the Facebook reporting tools out there.
So in this post, you'll find a breakdown of 6 powerful platforms you can choose from -- as well as the types of reports they can generate.
6 Facebook Reporting Tools for In-Depth Analysis
1. Simply Measured
Simply Measured has a great platform for brands & digital agencies -- but it's a bit out of reach for individuals & small businesses, with plans starting at $500 per month.
Fortunately, they do have a section of free reports to choose from for the top social networks, including 4 specifically for Facebook.
Each of the free reports can be downloaded to Excel or exported to Powerpoint.
Free Facebook Competitive Analysis Report
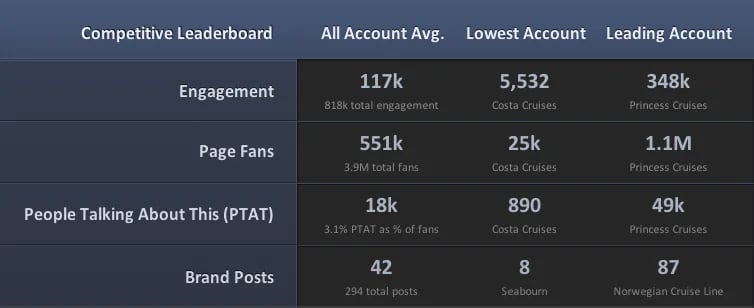
First, you have the Free Facebook Competitive Analysis Report. This report will benchmark the last 2 weeks of activity on your Facebook page against your competitors or other brands on Facebook.
You can use it to compare up to 10 fan pages with up to 250,000 likes.
First, you will get an overview of all of the pages you have entered for comparison.
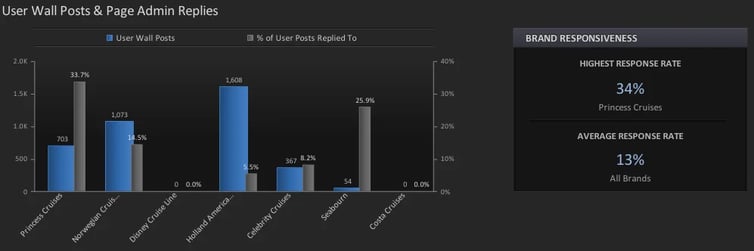
Next, you will find a series of charts showing how each of the brands compare in overall metrics.
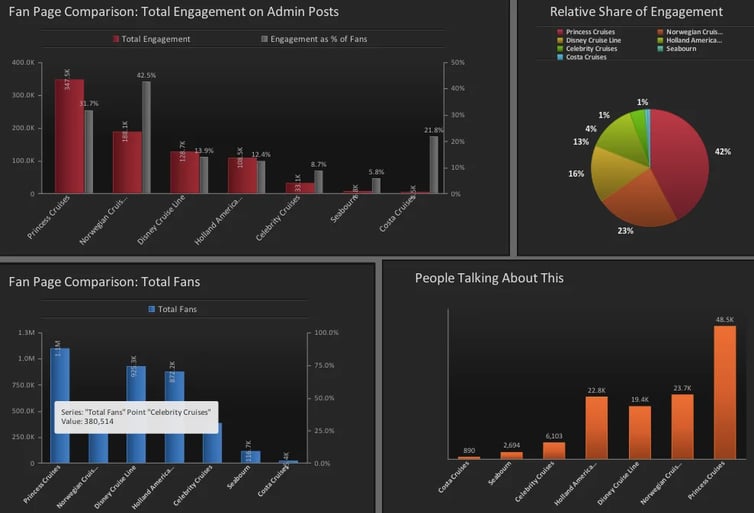
Engagement on admin posts.
Community health details (mostly focused on customer service).
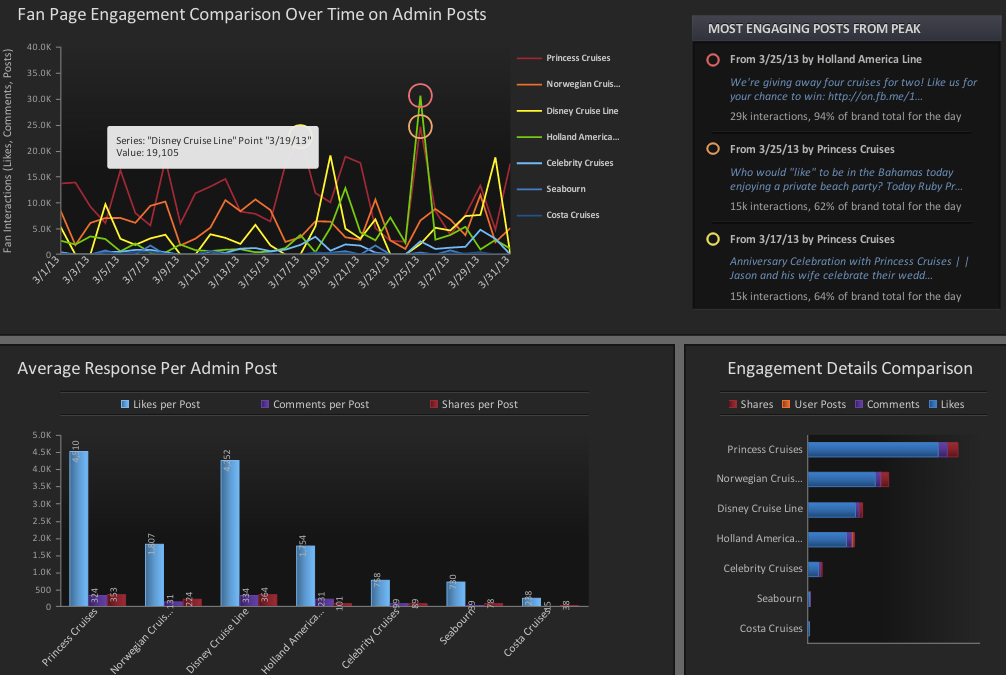
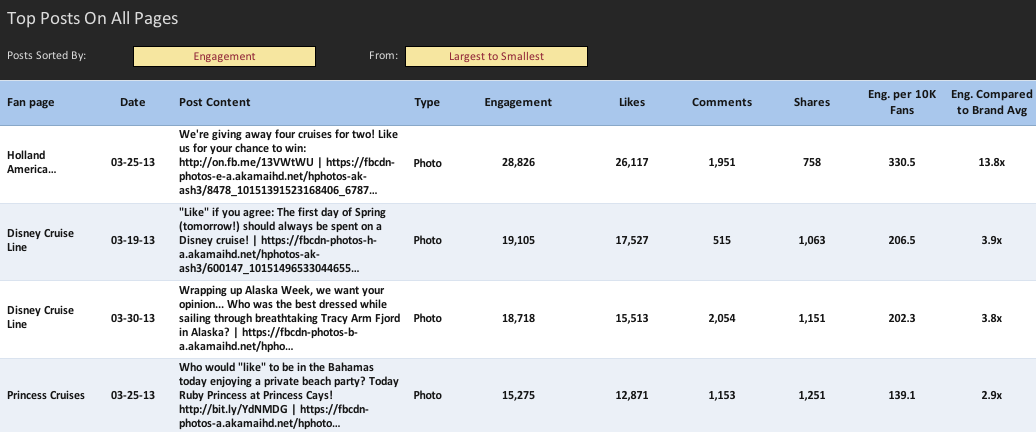
And finally, a detailed list of the top posts across all of the pages being compared along with:
- post type
- likes
- comments
- shares
- engagement rates
Free Facebook Fan Page Report
Next is the Free Facebook Fan Page Report.
This report answers questions about the last 2 weeks of a fan page's performance & engagement for pages with up to 250,000 likes.
This report shows in-depth data about your fan page (or your competitor's), starting with an overview.
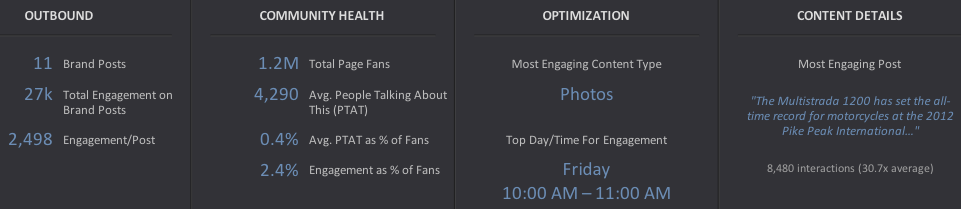
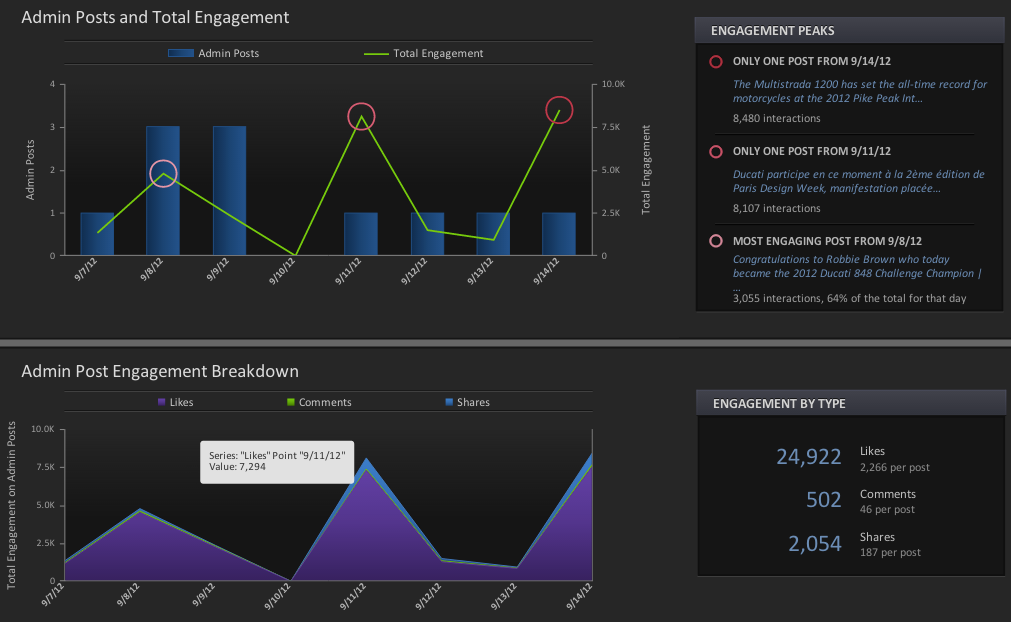
Admin post engagement.
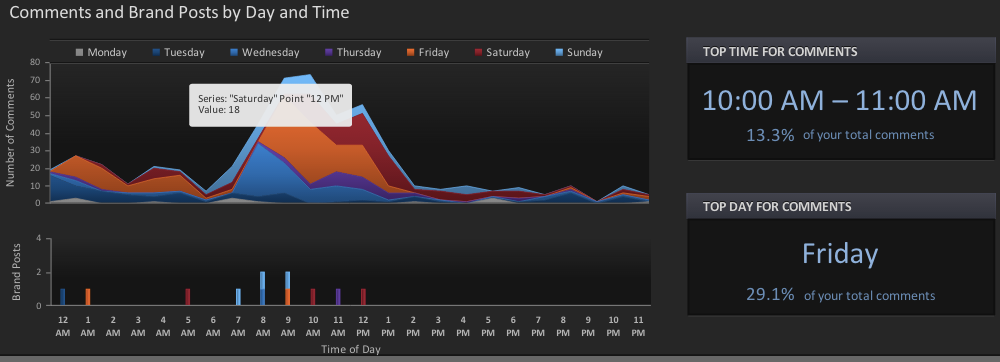
Engagement on posts made by users upon the Facebook page.
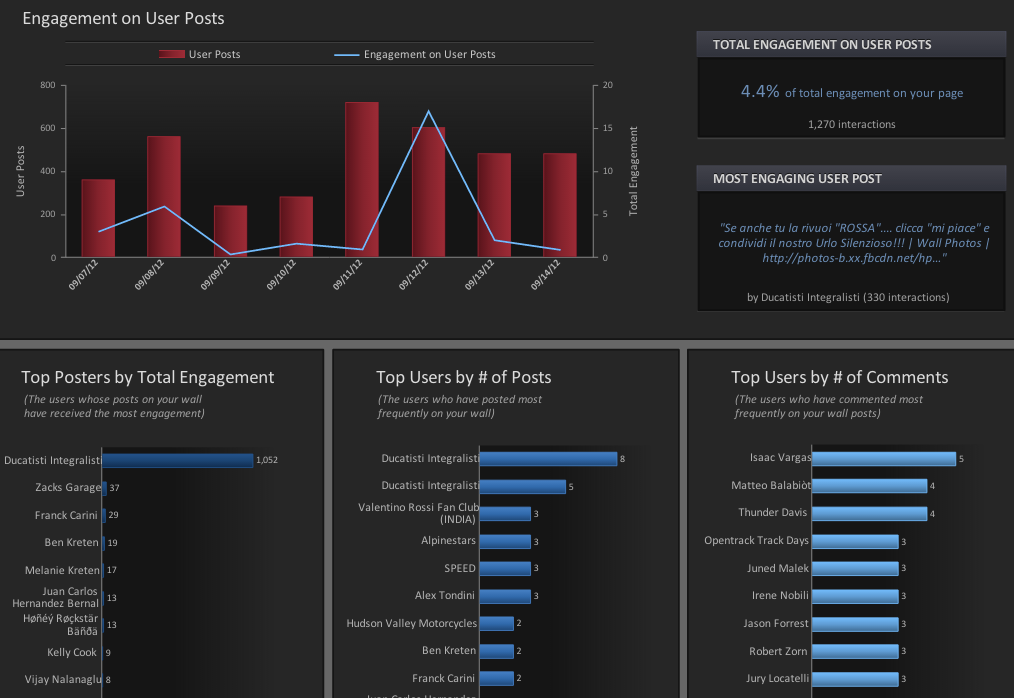
Date & time analysis of the top posts.
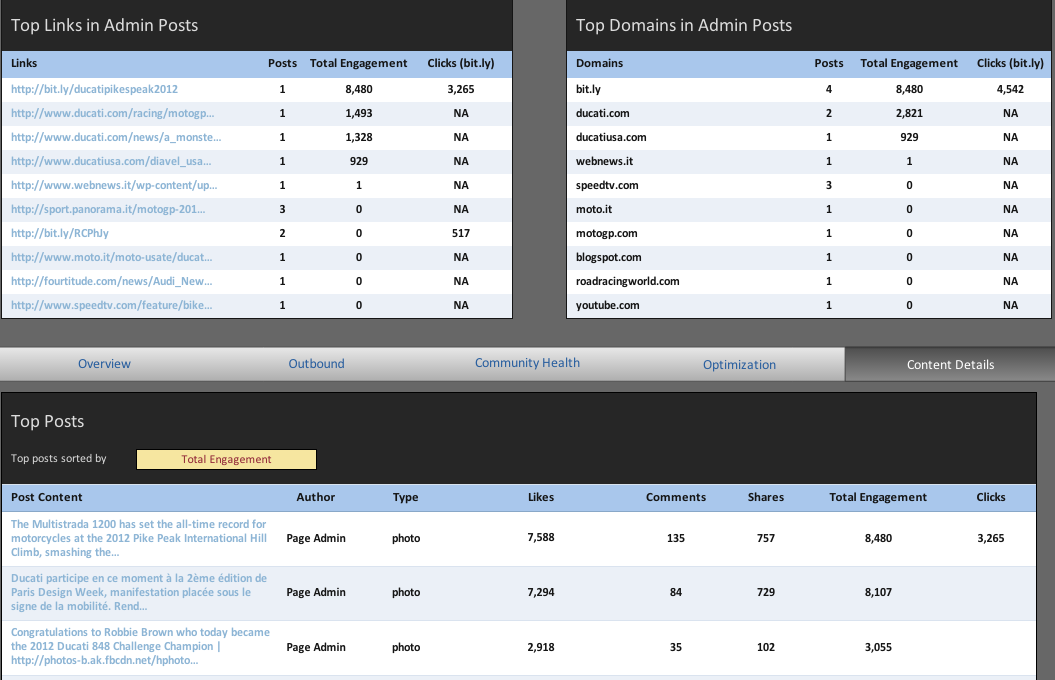
Followed by in-depth analysis of individual post content.
Free Facebook Insights Report
The Free Facebook Insights Report performs an in-depth analysis of the last 2 weeks of your Insights data (for pages with up to 2 million fans).
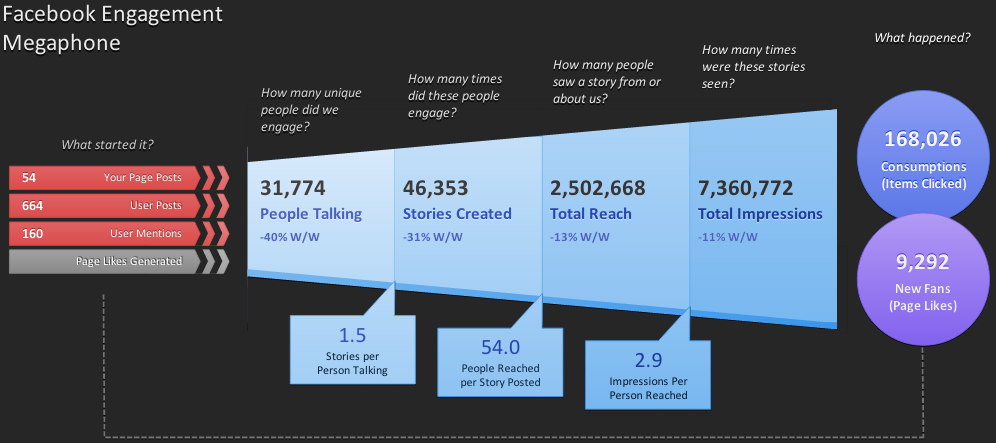
It starts with an engagement megaphone highlighting all of the important engagement data for:
- your posts
- user posts
- user mentions
- page likes generated
Next, you'll find your metrics overview.
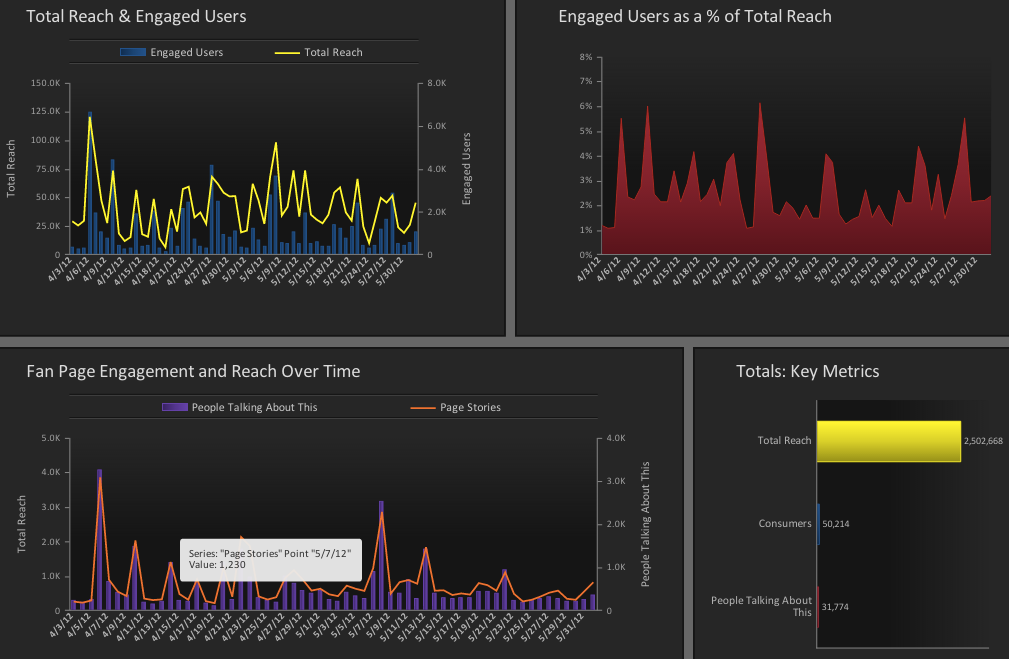
With in-depth insight into your messaging, stories, and engagement.
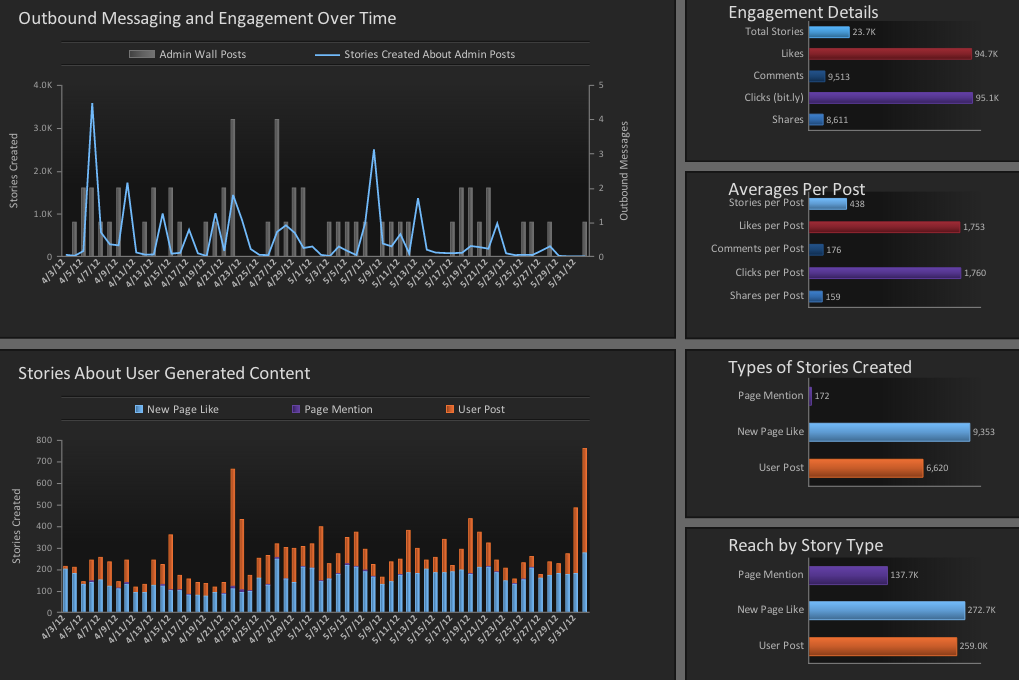
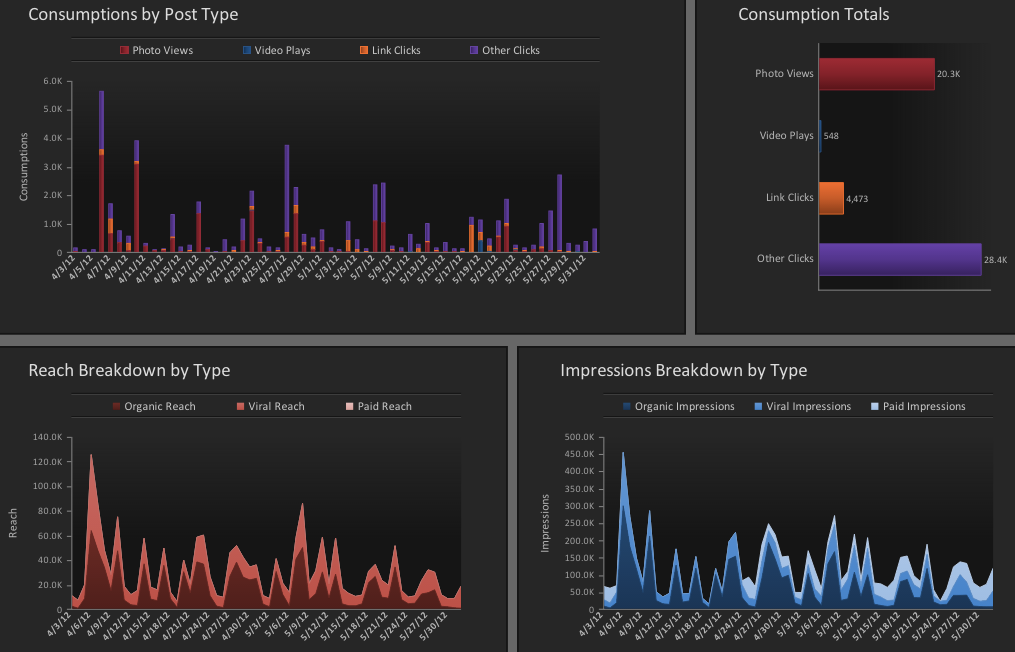
Post type details & impressions breakdown.
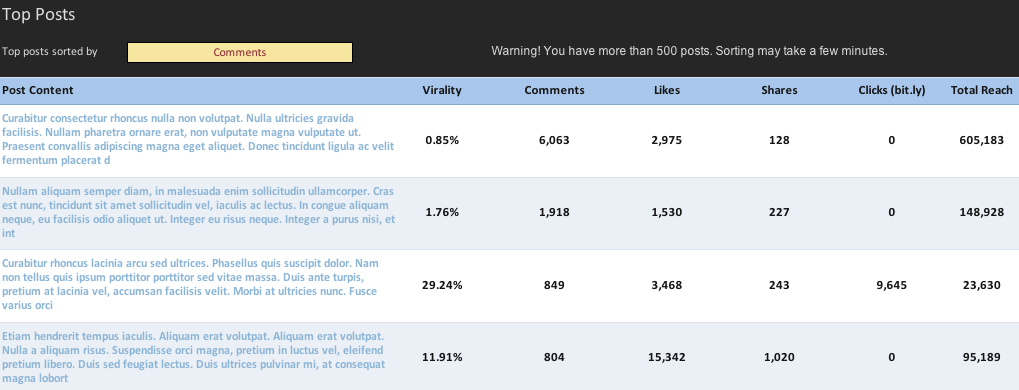
Top post details (this may take a while to load -- and in the meantime, you'll be shown this).
Additional engagement & impressions analysis.
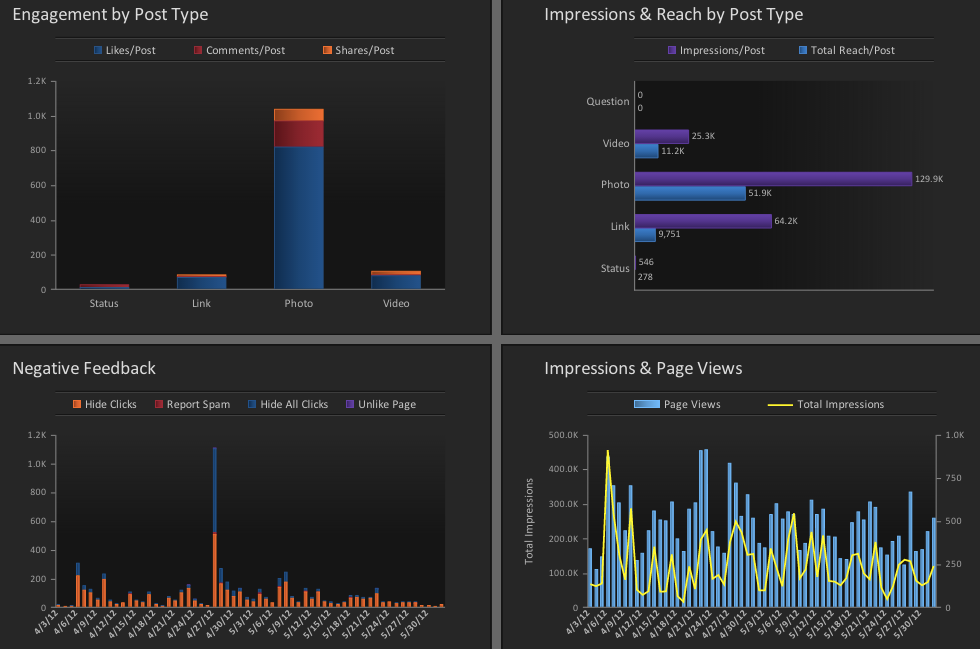
Page like details.
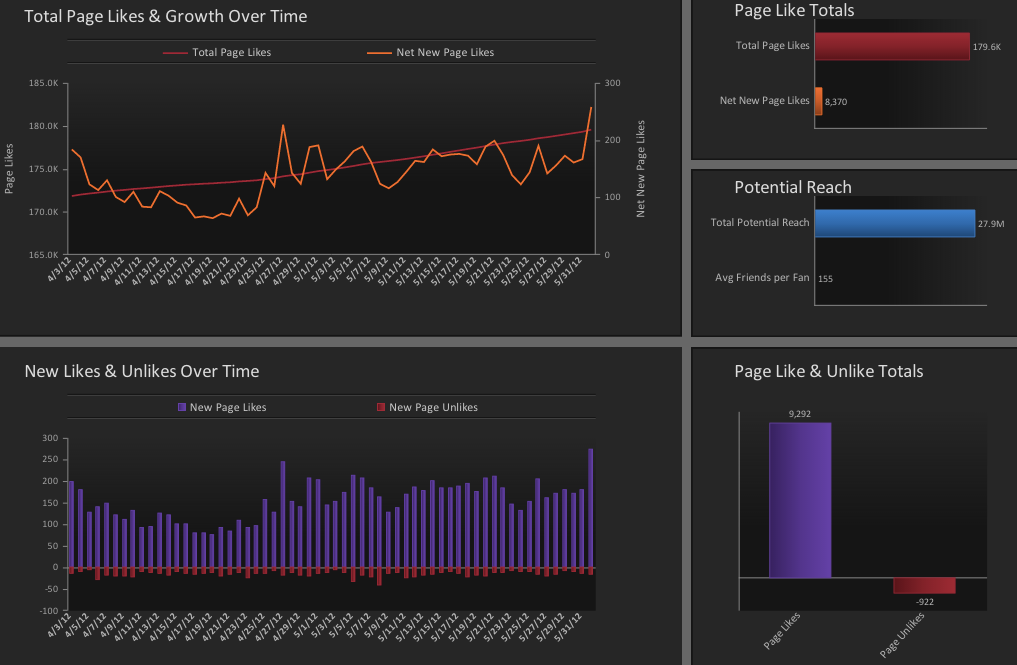
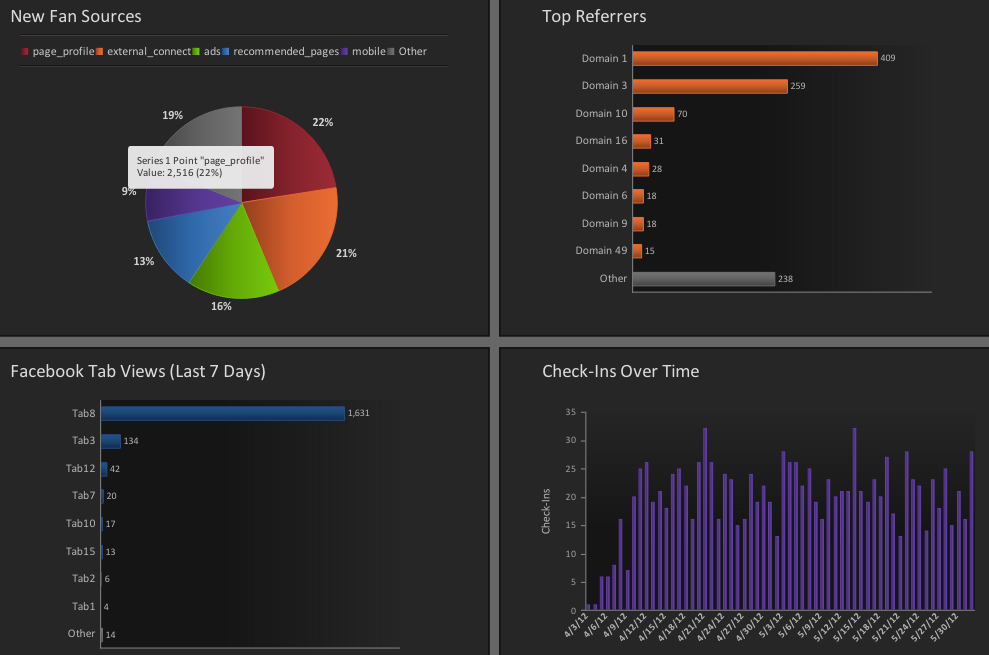
Fan statistics, traffic sources, and activity.
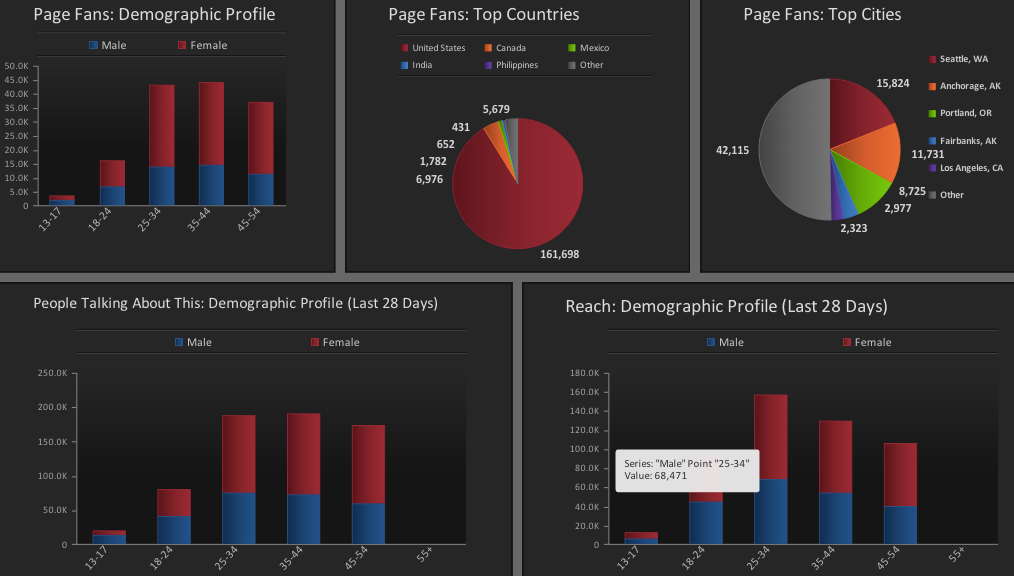
And demographics.
If you don't like looking at your Facebook Insights or need a better interpretation of them, this is the report to choose.
Free Facebook Content Analysis
The final free report for Facebook is the Content Analysis report.
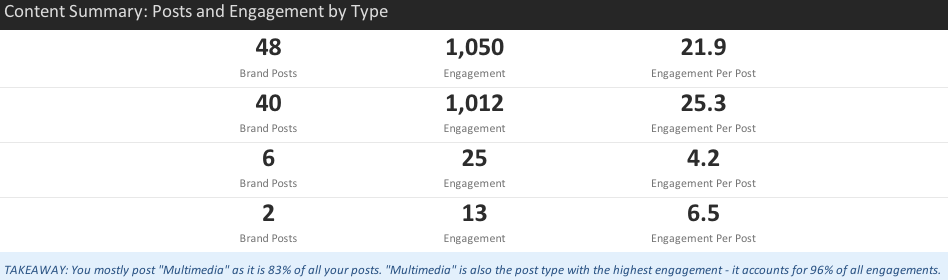
It analyzes the last 2 weeks of your posts on Facebook to identify which types of posts are best in terms of engagement for your pages (or competitor's pages) with up to 250,000 likes.
It starts with a content summary & takeaway for the page you are analyzing.
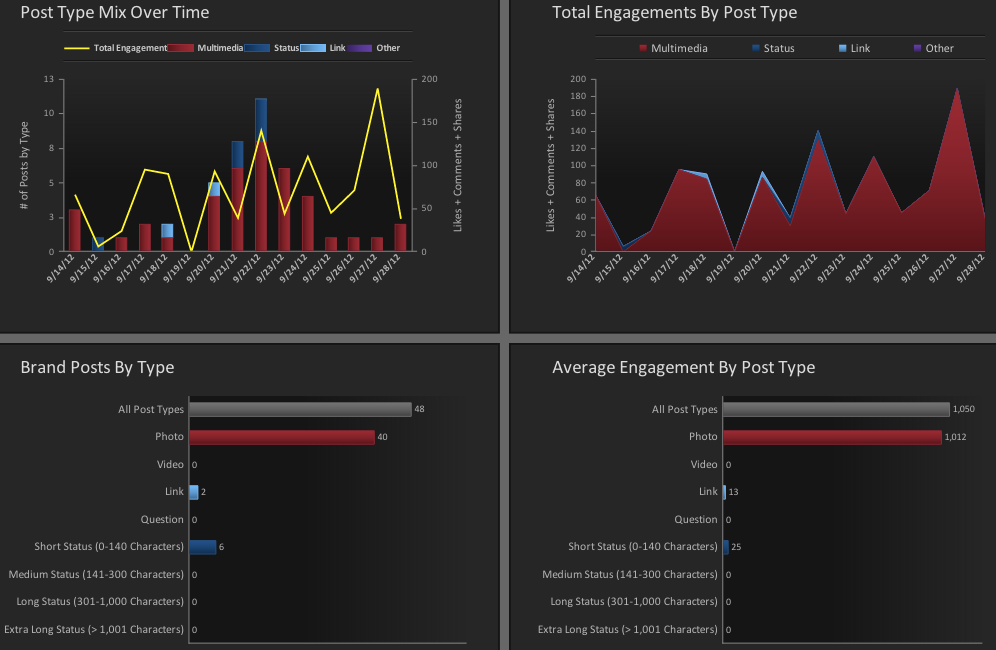
Next, it begins to examine post type usage & engagement.
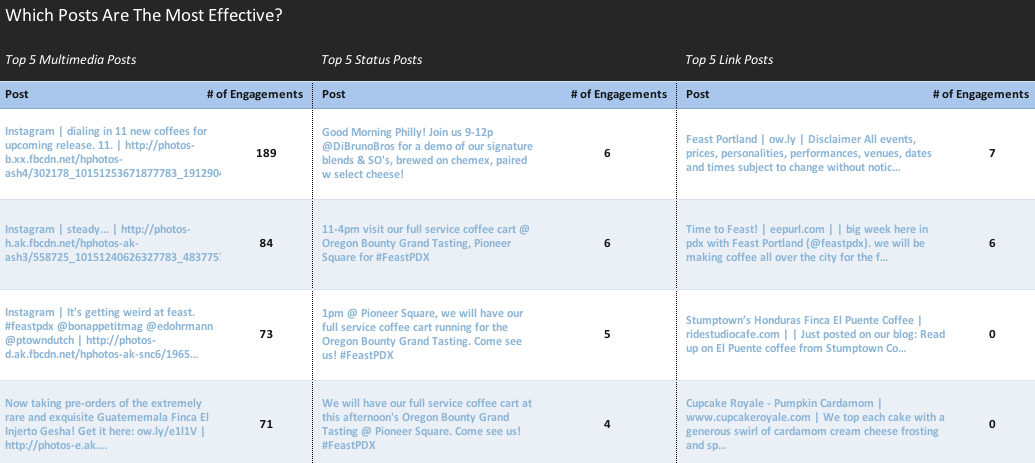
Followed by the top posts of each type.
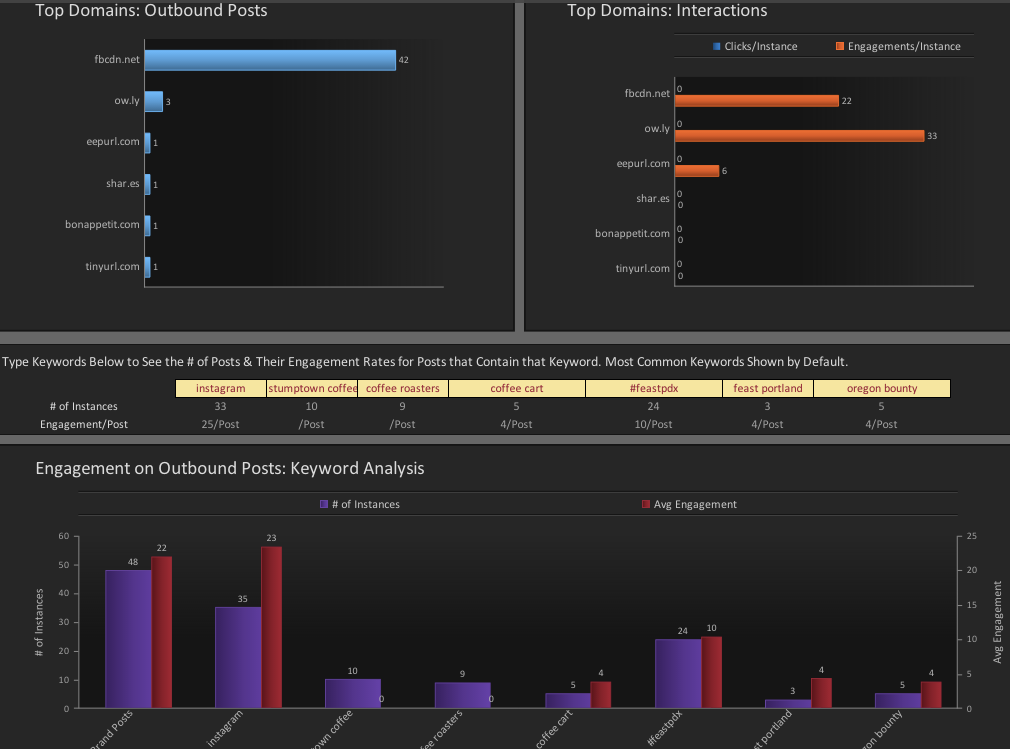
And ending with common domains & keywords found in the top posts.
Overall, you really can't go wrong with this set of free reports.
While Simply Measured doesn't charge you for the reports, they do require you to post an update about the report you are running (not the details -- just a link to the reporting tool itself) to your Facebook account.
2. Social Bakers
Social Bakers is an analytics platform that allows you to monitor your Facebook, Twitter & YouTube profiles -- along with your competitors.
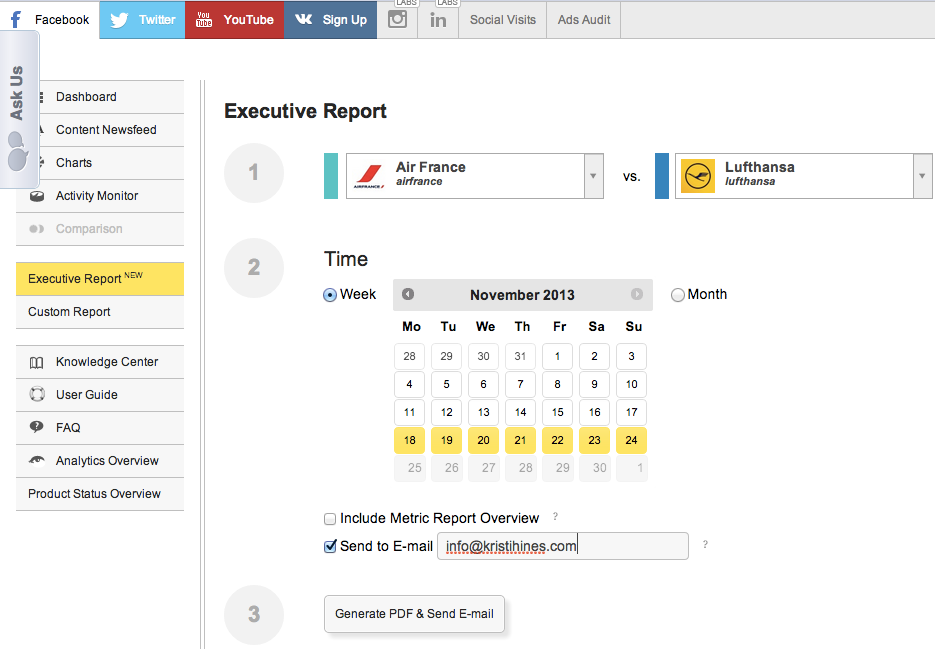
It allows you to create PDF reports based on their standard Executive Report template, or create a custom report of your own.
Reports can analyze your own Facebook page's activity alone or alongside your competitors.
Creating a report is easy. Just click on Executive Report in the left sidebar & choose from the pages you have set up in your account -- along with a timeframe to analyze.
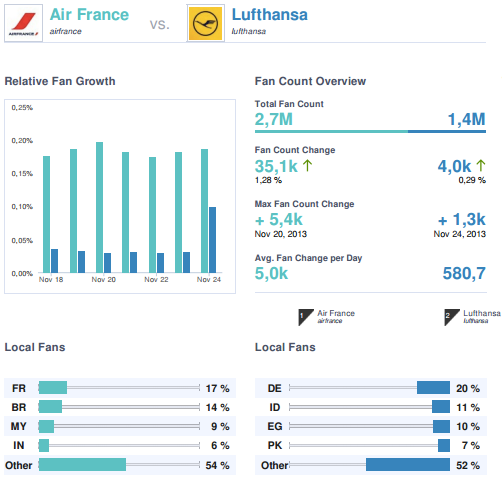
The resulting PDF will show a full summary of your Facebook Page Insights compared to your competitors.
This data includes your fan growth & demographics.
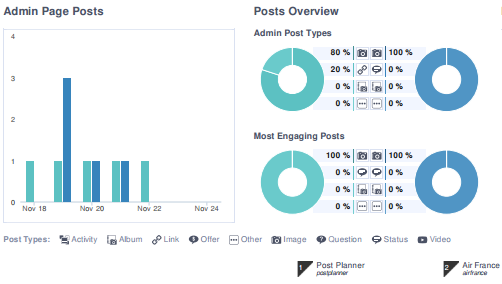
A summary of your admin page posts, post types, and engagement.
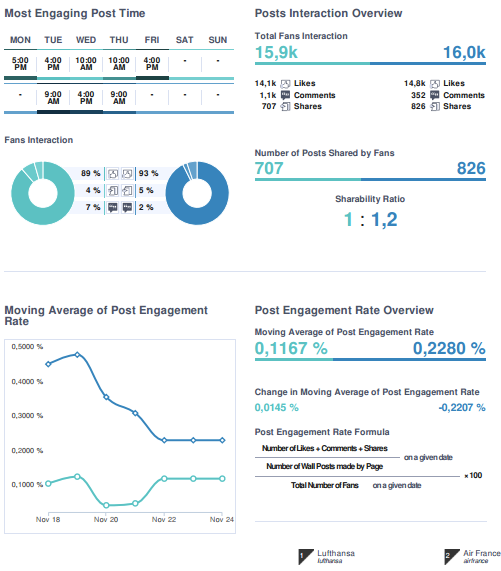
Post engagement data including the times the most engaging posts were published, a breakdown of engagement types (likes, comments & shares), and additional details.
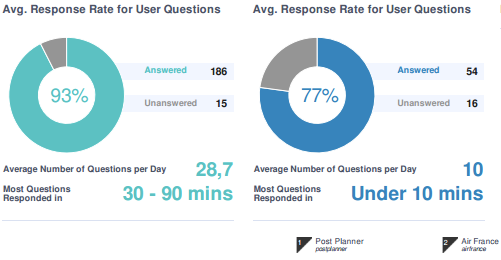
Average response rate for user questions, including the average number of questions per day & time the questions were responded too (great for businesses that deal with customer service on Facebook).
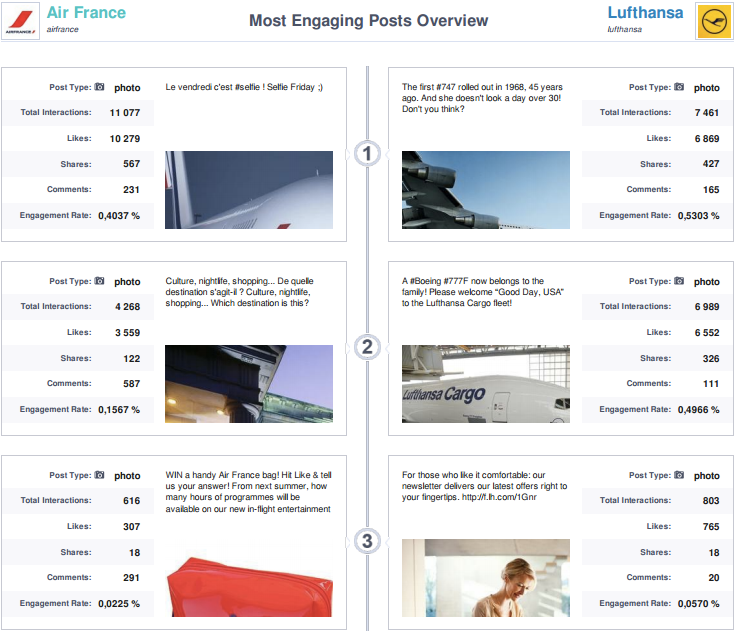
And a visual side-by-side comparison of the top five most engaging posts from the time period you selected -- each noted by its type, total interactions, likes, shares, comments, and overall engagement rate.
When sending this off to your CEO, your consulting customers, or people who might not be familiar with the jargon related to Facebook Insights, you can also attach a Metric Report Overview, which includes a glossary defining terms from Share to Relative Fan Growth.
Social Bakers offers very in-depth analysis of your Facebook activity along with your competitors. Their pricing plans are based on the number of Facebook pages, Twitter profiles, or YouTube channels you want to monitor.
A single page, profile, or channel is $50 per month -- and this increases to $100 per month if you want to monitor your business page with 2 of your competitor's business pages.
Standard package pricing goes up to 100 pages, profiles, or channels for $2,000 per month. Custom plans are also available upon request.
3. Sprout Social
Sprout Social is a popular social media management tool for businesses of all sizes.
One of the great features of their platforms is the ability to run reports on your individual accounts, including Facebook pages.
Reports can be exported as PDF or CSV for a period of 15 - 90 days or custom time period of up to 2 years.
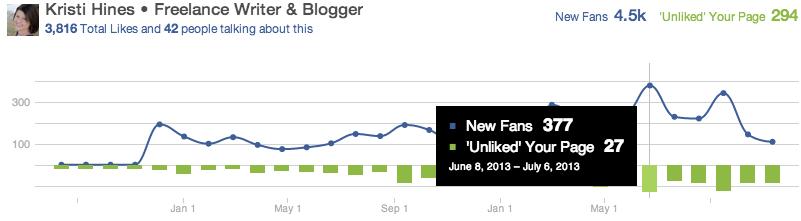
First, you will see the growth of your audience including new likes & unlikes.
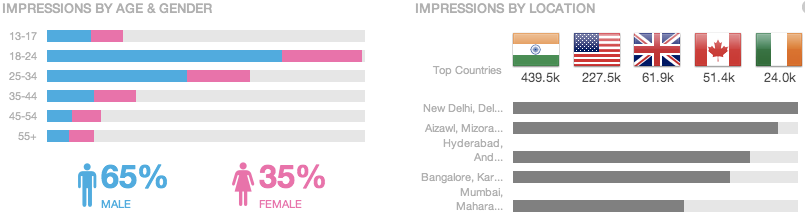
Next, you'll find your page impressions over time -- including a breakdown of types & by date.
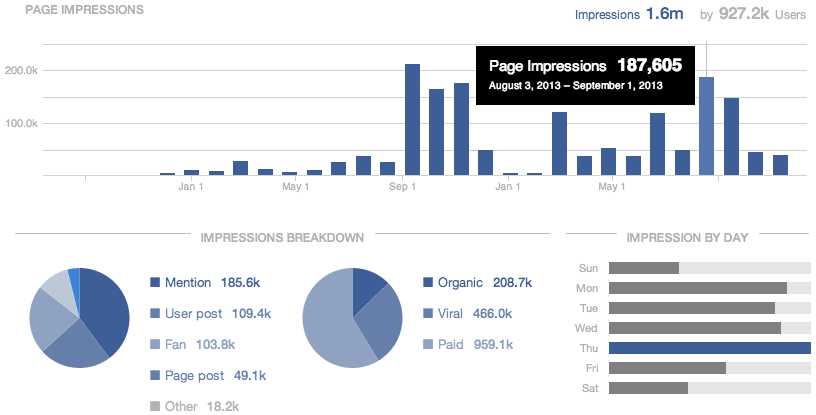
Beneath that, you'll find the demographic breakdown of your impressions.
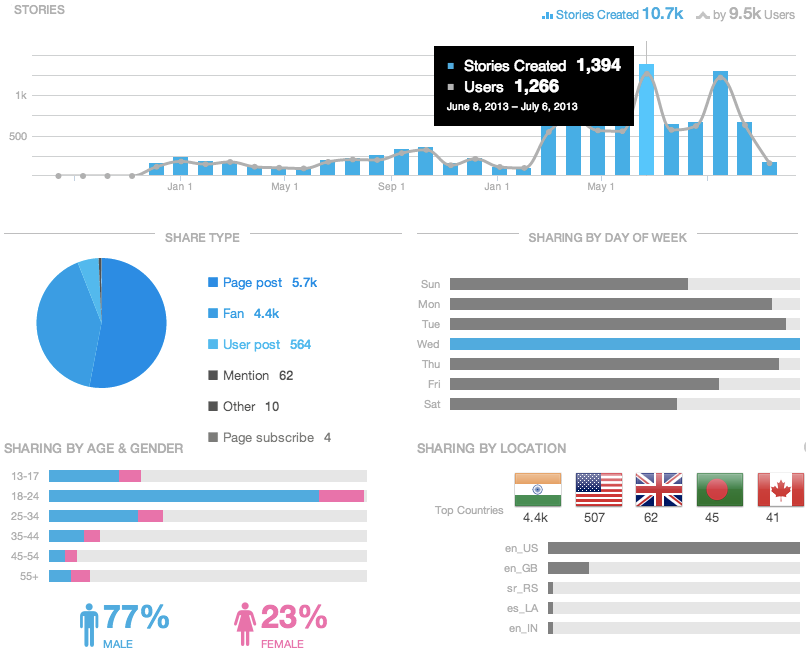
In the following section about sharing, you'll see the timeline of stories created about your page, share types, popular dates, and demographics.
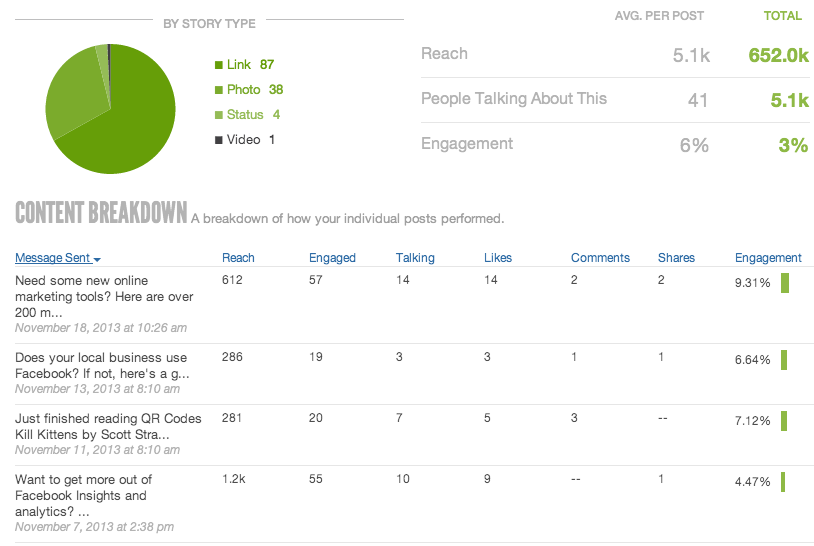
Finally, you'll find a section devoted to showing engagement on your posts with a breakdown of engagement statistics per post.
If you select a date range of 2 years, you'll see data about all of your posts during that time period.
Sprout Social starts at $39 for the management of up to 10 profiles.
Pricing then moves up to $59 for management of up to 20 profiles, and $99 for management of up to 50 profiles. Enterprise level accounts also available.
4. Rival IQ
Another great competitor research tool that creates brilliant reports is Rival IQ.
You start by creating a landscape that includes your company and your competitors.
Then you'll find Facebook data you can use to compare your Facebook page with your competitors, starting with the basic metrics -- likes, posts, talking about, and engagement rates.
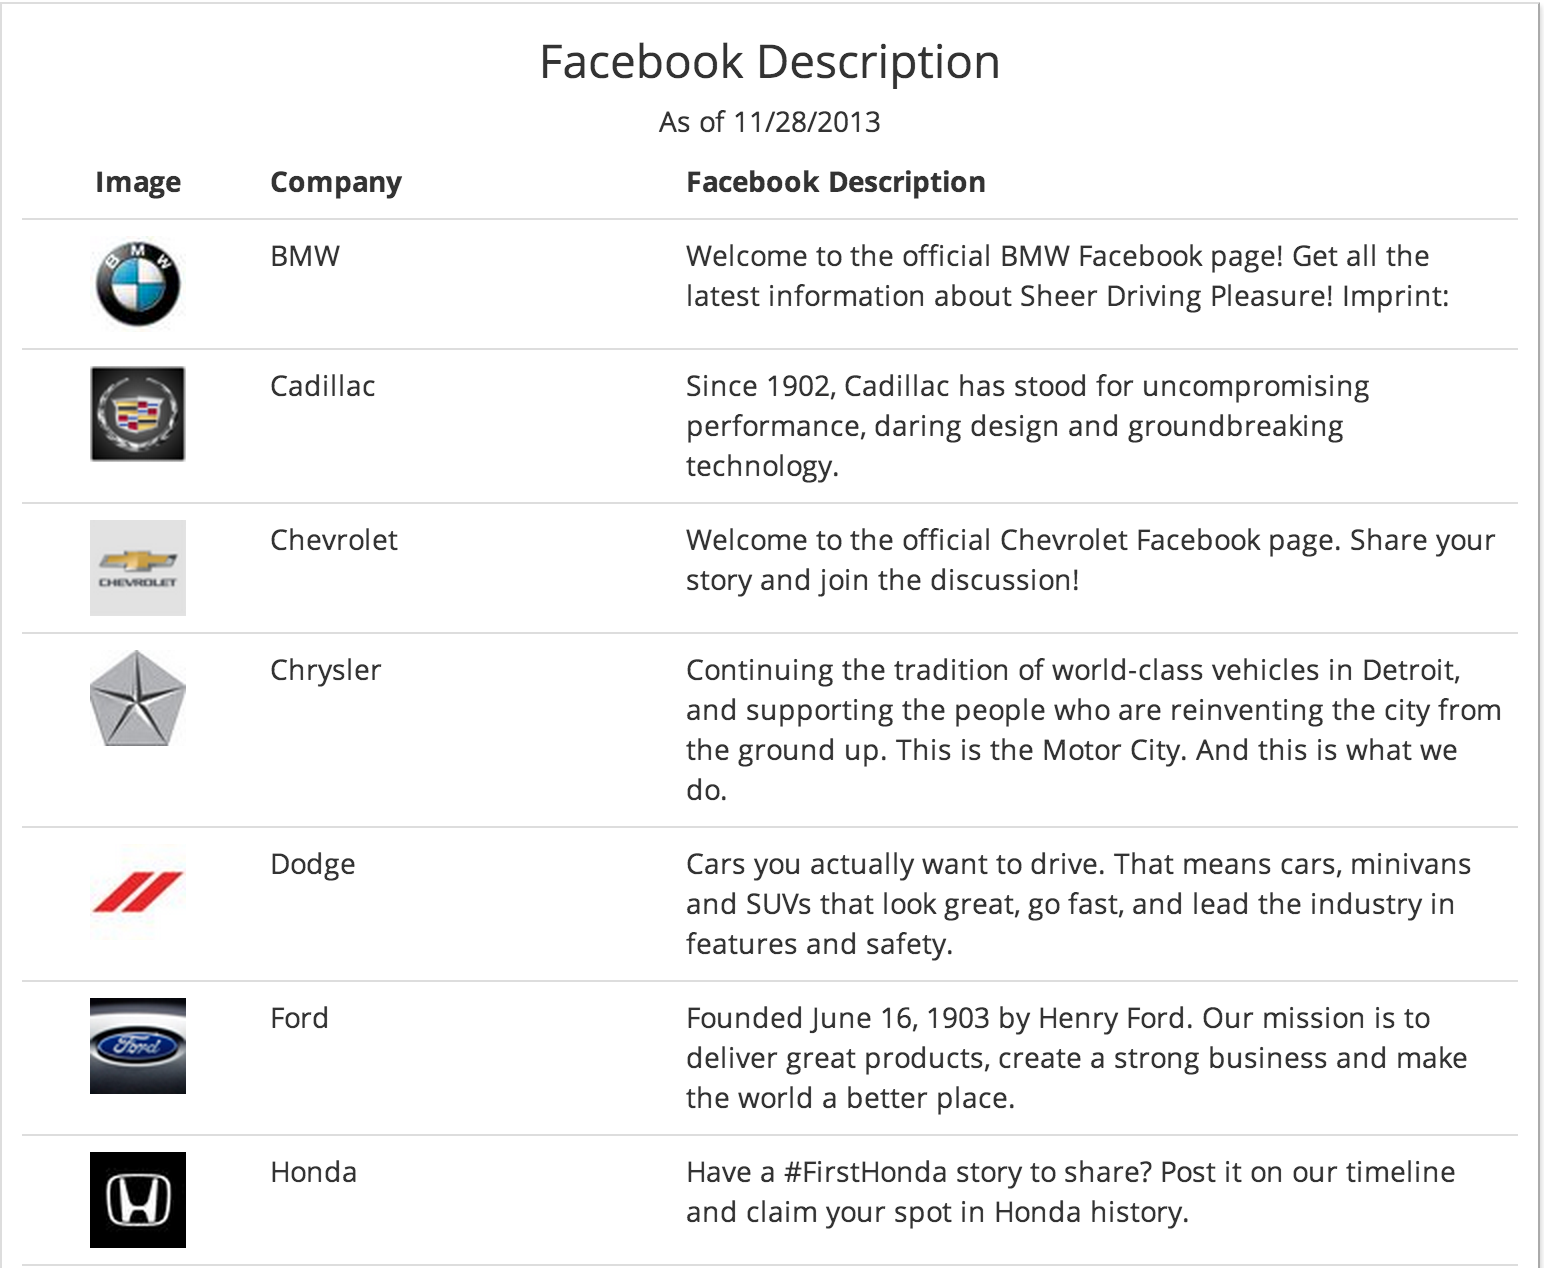
The unique data that they pull is the about descriptions from each Facebook page.
If you're not sure how to describe your business, you can get a quick summary of how your competitors are doing it.
Best of all, you can keep up with the changes your competitors make by looking under the social bio changes section.
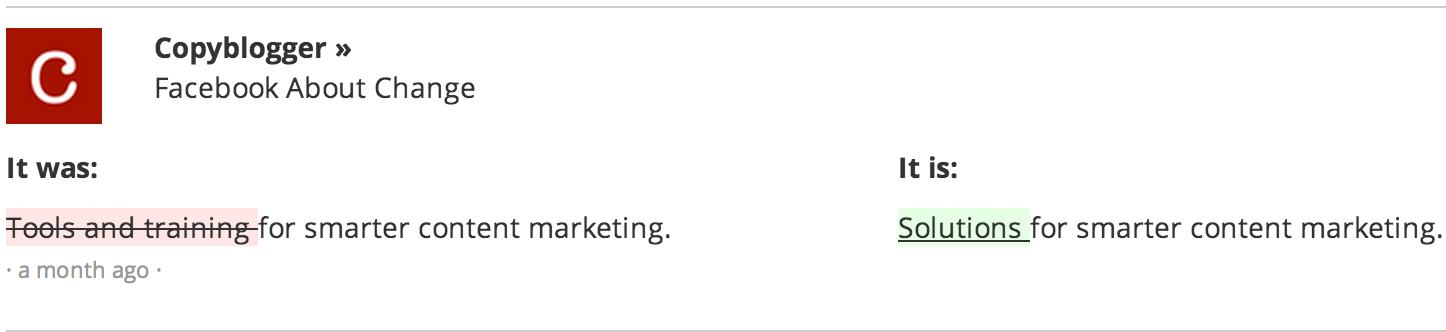
With exception of the changes (which are emailed to you on a regular basis), the metrics & descriptions can be exported into PDF, PNG, or PowerPoint report format.
This makes it a powerful tool for businesses who want to keep up with the competition as well as consultants who want to give potential clients a reason why they need help with their online presence.
Aside from Facebook, you can also analyze & monitor competitor data from their website & other social networks.
Pricing for Rival IQ begins at $99 per month for monitoring of one landscape, or set of similar businesses (yours + your competitors).
Agencies who need to monitor more groups of clients can choose from the Pro Plus package at $199 per month, the Agency package at $399 per month, or have a custom plan created with volume pricing.
5. Cyfe
Do you like viewing your analytics in dashboard format? And do you need to generate reports from that data?
If so, Cyfe may be the reporting tool for you.
You can use it to create dashboards based on specific insights from your own pages.
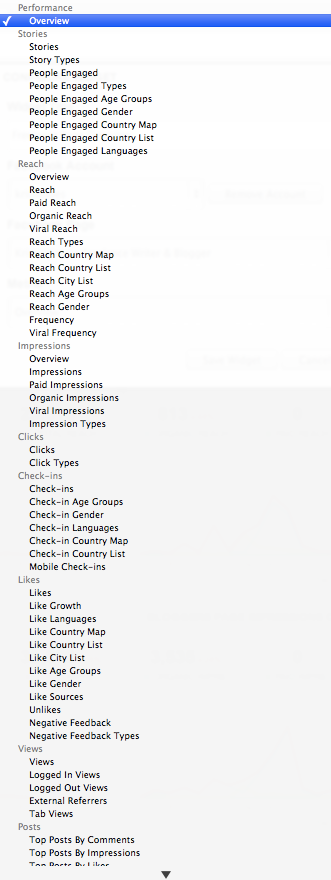
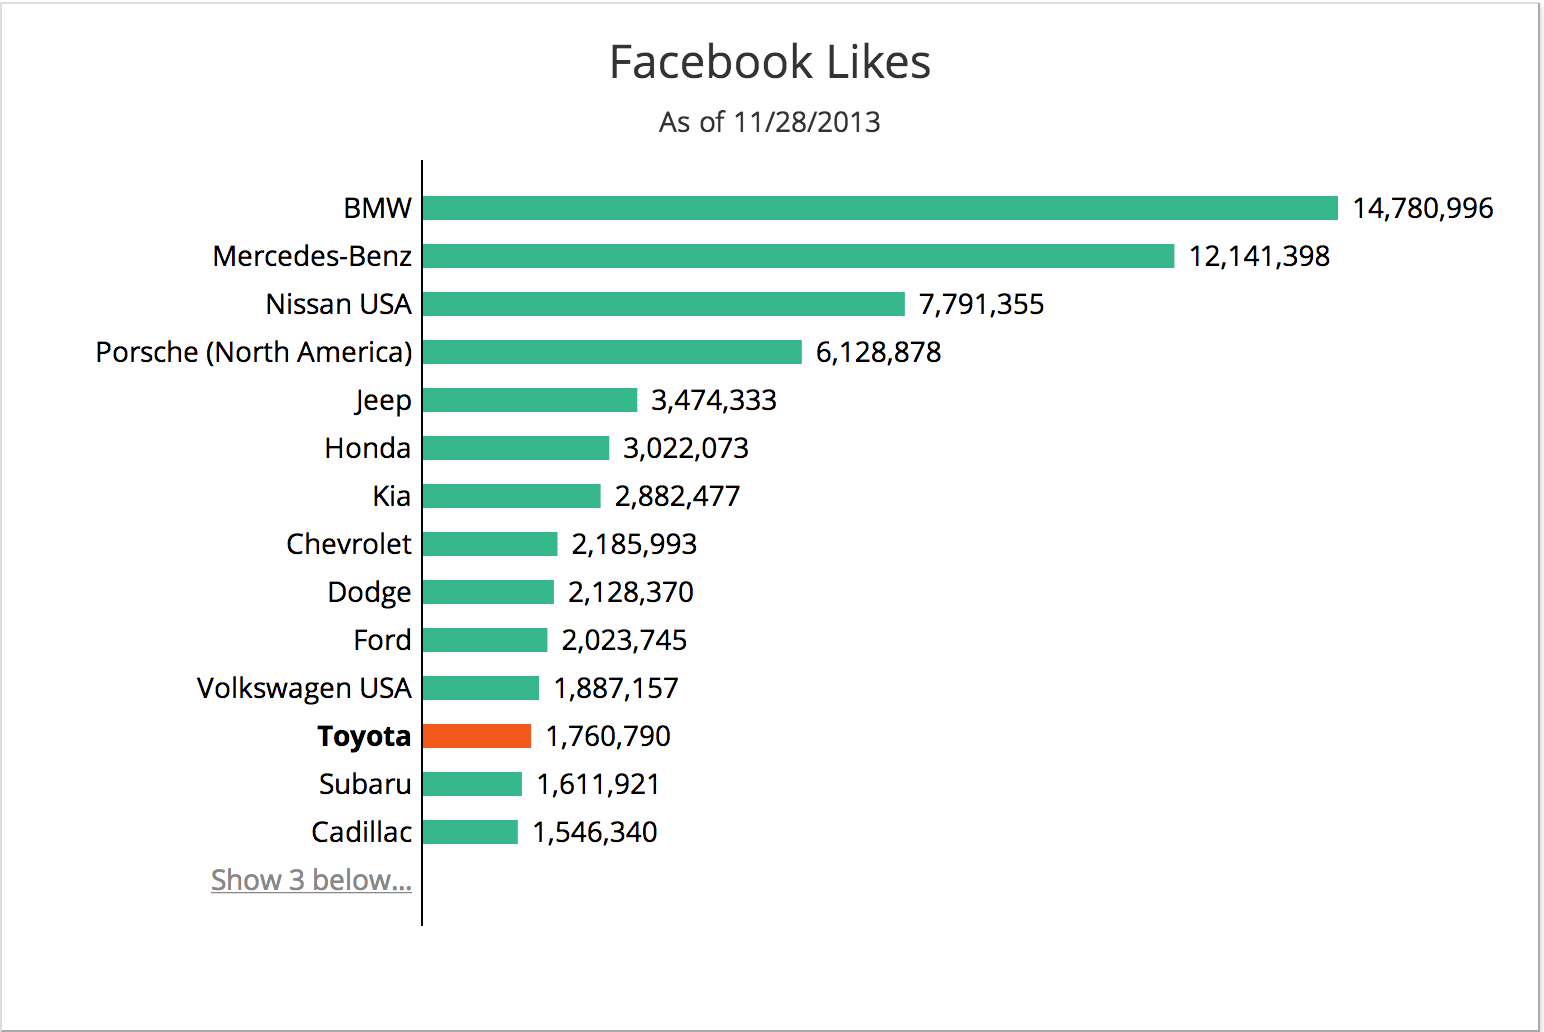
Cut off at the bottom of this list are posts by likes, reach & shares.
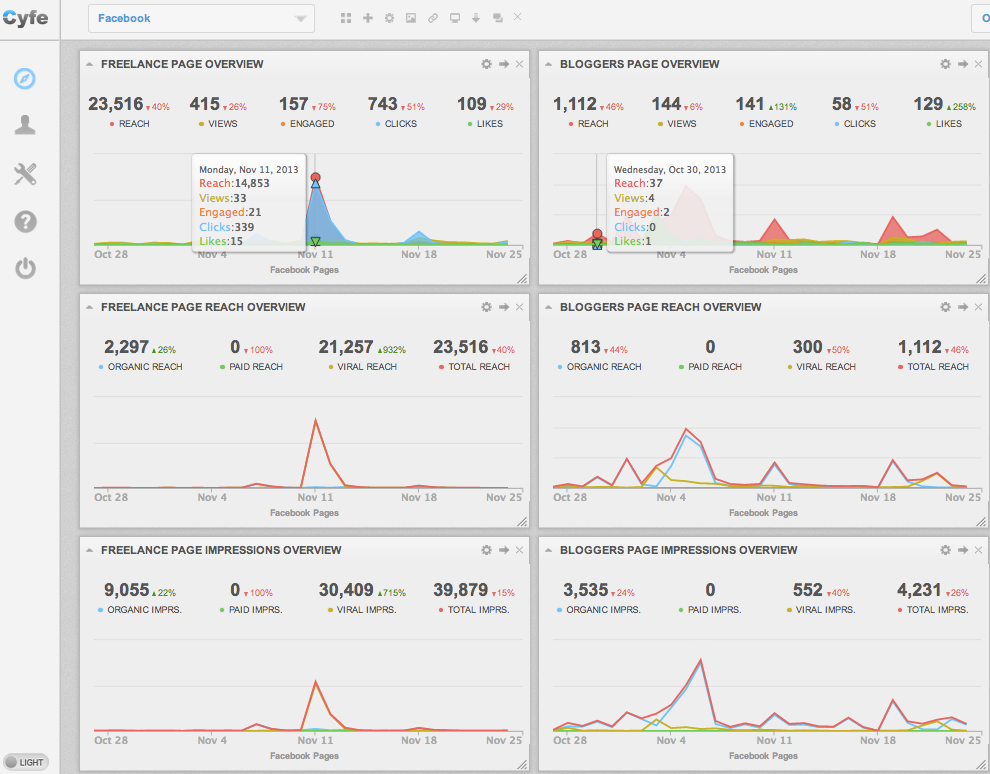
Once completed, your dashboard will look something like this.
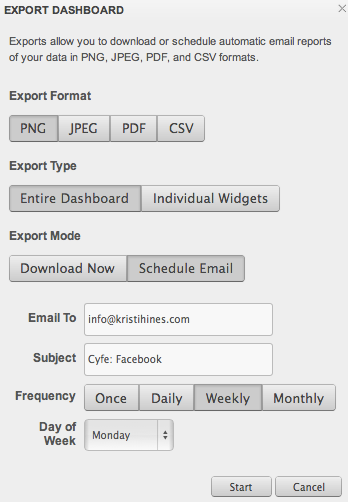
You can create reports based off of your dashboard data and have those reports sent at regular intervals in PNG, JPEG, PDF, or CSV format by using the export dashboard option.
Dashboards can be created & used for reporting in various ways.
- People managing a Facebook page for their business can create a comprehensive dashboard of their Facebook page data and have reports emailed regularly to themselves, their CEO, and the marketing team.
- People managing multiple Facebook pages for their business can create a dashboard comparing the activity of each page to see which pages are flourishing and which ones need improvement.
- People managing multiple Facebook pages for different clients can create separate dashboards per client and send reports to their clients.
In addition to sending regular reports, you can also give viewing access of individual dashboards to users so that they can monitor the Facebook statistics at any time.
Cyfe is very reasonably priced for individuals & small businesses at $19 per month for unlimited everything - dashboards, widgets, account connections, and user accounts.
This makes it a great tool for Facebook reporting.
As an added bonus, you can also create dashboards monitoring all of your other marketing platforms, networks, and tools including Google Analytics, the top social networks, mailing list service providers, and much more.
6. Google Analytics Custom Report
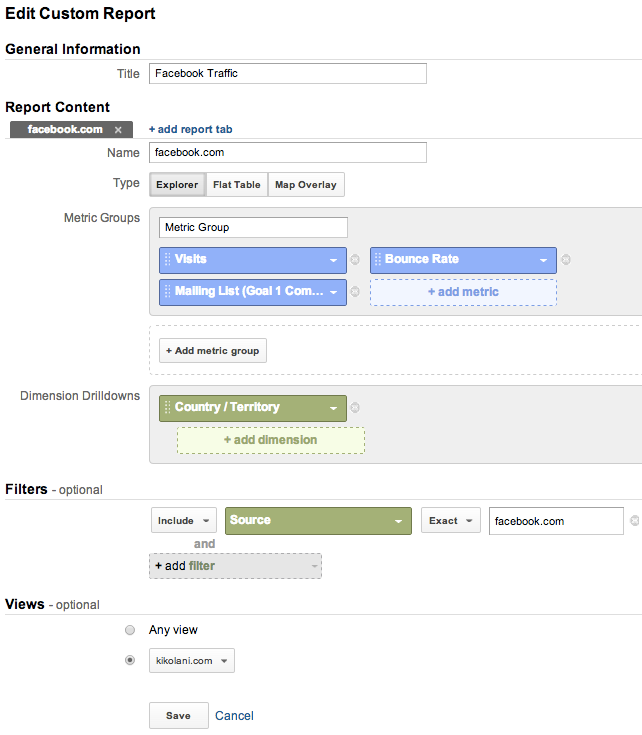
Google Analytics allows you to create custom reports that analyzes the traffic you receive from Facebook in a variety of ways.
For example, you can create a report that shows the country Facebook visitors are from in relation to the number of visits, bounce rate, and conversion rate on your top Google Analytics goals.
To set this up, you would go to the Customization tab on your Google Analytics profile and create a new report.
Then your report configuration would be set up as follows.
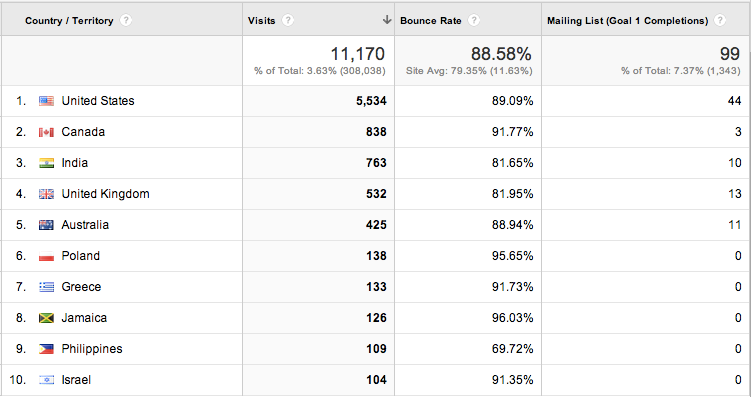
When you save the report, you would get an explorer view of the data.
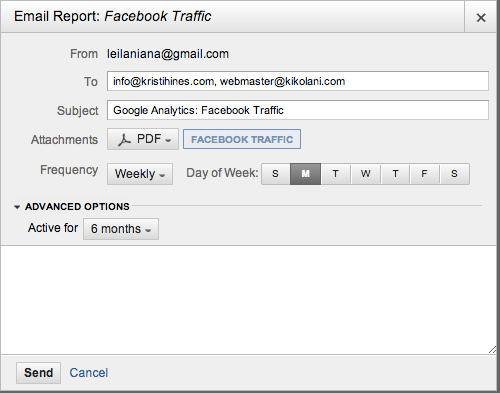
To send the report one time or on a recurring basis, click on the Email button under the name of your report.
This will allow you to configure your report to be sent to the email addresses you specify in a specific format (CSV, TSV, Excel, or PDF), on a specific day at the frequency you choose for the duration you choose.
The document, depending on the format you choose, will look similar to the explorer view you saw after saving the report.
When it comes to Google Analytics Custom Reports, you will have the opportunity to customize the most important information to your business about your Facebook traffic and have it sent on a regular basis.
If you hate visiting Google Analytics on a regular basis, this is a great way to get the data you need without having to always log in. Best of all, it's always free!
What else?
Of course, these are just 6 of the many awesome tools out there. Others include:
- AgoraPulse
- RavenTools
- Sysomos
- Hootsuite
- and plenty more
I'd encourage you to test as many as you can to decide which one is right for you.
What are your favorite Facebook reporting tools? Please share in the comments!


ViewHide comments (10)